
Your one-stop destination to learn about Prop Firms, Forex, Binary Options, and Cryptocurrency.
Chapter 3: Technical Analysis for Forex Trading
Page Contents:
1- Candlestick charts and Candlestick Patterns
2- Support and resistance levels or Supply and Demand Zones
5- Indicators (RSI, MACD, etc.)
CLICK HERE FOR: Chapter 4: Fundamental Analysis for Forex Trading.

What are Candlestick charts ?
Candlestick charts are a popular tool used by Forex traders to analyze market trends and make informed trading decisions. These charts have been used for centuries in Japan to track the price of rice, but they have now become a widely used tool in Forex trading. In this article, we will explain the basics of candlestick charts and how to use them to your advantage in Forex trading.
What are Candlestick Charts?
Candlestick charts are a type of chart used to represent the price movements of an asset over a period of time. They consist of a series of individual "candlesticks," each representing a specific time period. The body of each candlestick represents the opening and closing prices of the asset during the time period, while the wick (or shadow) represents the high and low prices.
The color of each candlestick can vary depending on the direction of the price movement. If the closing price is higher than the opening price, the candlestick is usually green or white. If the closing price is lower than the opening price, the candlestick is usually red or black.
Using Candlestick Charts in Forex Trading
Candlestick charts can be used to identify trends and patterns in the market, which can be used to make informed trading decisions. Here are a few ways that you can use candlestick charts to your advantage in Forex trading:
-
Identifying Trends: Candlestick charts can be used to identify trends in the market, which can be helpful in determining whether to buy or sell a currency pair. An uptrend is identified by a series of higher highs and higher lows, while a downtrend is identified by a series of lower highs and lower lows.
-
Recognizing Reversals: Candlestick charts can also be used to recognize potential reversals in the market. A "bullish engulfing" pattern occurs when a small candlestick is followed by a larger candlestick that "engulfs" the first candlestick. This can indicate a reversal in the price trend and can be used as a signal to enter a long position. A "bearish engulfing" pattern is the opposite and can indicate a reversal in the price trend and a signal to enter a short position.
-
Using Indicators: Candlestick charts can be used in conjunction with technical indicators, such as moving averages and RSI, to confirm potential trading signals. For example, if a bullish engulfing pattern is identified, a trader may use a moving average crossover as a confirmation signal to enter a long position.
-
Managing Risk: Candlestick charts can also be used to manage risk in Forex trading. Traders can set stop-loss orders based on key support and resistance levels identified on the chart, which can limit their losses if the market moves against them.
In conclusion candlestick charts are a valuable tool for Forex traders, providing a visual representation of price movements that can help identify trends and patterns in the market. By using candlestick charts in conjunction with technical indicators and risk management strategies, traders can make informed trading decisions and improve their chances of success in Forex trading. It is important to keep in mind that candlestick charts are just one tool among many that traders can use to analyze the market, and should not be relied on exclusively.
Bullish CandleStick

High
Close
Open
Low
Bearish CandleStick

High
Open
Close
Low
Introduction to Different Candlestick Patterns
Candlestick charting is a powerful tool for analyzing price movements in the financial markets. By studying the shape, color, and placement of candlesticks on a price chart, traders can gain valuable insights into market trends and make informed trading decisions.
There are many different candlestick patterns, each with its own unique characteristics and applications. Some patterns, like the Bullish Engulfing and the Morning Star, signal a potential trend reversal or a change in market sentiment. Others, like the Hammer and the Inverted Hammer, suggest that buyers are stepping in to support a falling market.
Still, other patterns, like the Doji and the Long-Legged Doji, indicate indecision in the market and can be used as a signal to wait for further confirmation before taking a position. And some patterns, like the Three White Soldiers and the Three Black Crows, suggest that the market is moving strongly in one direction.
At the end of the day, understanding candlestick patterns is essential for any trader looking to gain an edge in the financial markets. By incorporating candlestick analysis into your trading strategy, you can increase your chances of success and improve your overall profitability.
Bullish Engulfing Pattern

-
The bullish engulfing pattern is a candlestick pattern that occurs in a downtrend and suggests a potential reversal to an uptrend.
-
The pattern consists of two candlesticks, with the first candlestick being a red (or bearish) candlestick and the second candlestick being a green (or bullish) candlestick.
-
The green candlestick completely engulfs the red candlestick, with the opening price of the green candlestick below the closing price of the red candlestick and the closing price of the green candlestick above the opening price of the red candlestick.
-
The bullish engulfing pattern indicates that buyers have taken control of the market and are pushing the price higher.
-
The pattern can be a strong signal of a potential trend reversal, but it's important to confirm the pattern with other technical indicators and market analysis.
-
Some traders use the bullish engulfing pattern as a buy signal, placing a long position with a stop loss below the low of the red candlestick and a profit target based on the potential length of the uptrend.
-
Traders should also consider the overall market context and fundamental factors that may be influencing the price action, as well as any potential risks or uncertainties that could impact the trade.
Overall, the bullish engulfing pattern is a popular candlestick pattern among traders, as it can provide valuable insights into potential trend reversals and opportunities for profitable trades. However, it's important to use the pattern in conjunction with other technical indicators and market analysis, and to always consider the potential risks and uncertainties of the trade.
Bearish Engulfing Pattern

-
The bearish engulfing pattern is a candlestick pattern that occurs in an uptrend and suggests a potential reversal to a downtrend.
-
The pattern consists of two candlesticks, with the first candlestick being a green (or bullish) candlestick and the second candlestick being a red (or bearish) candlestick.
-
The red candlestick completely engulfs the green candlestick, with the opening price of the red candlestick above the closing price of the green candlestick and the closing price of the red candlestick below the opening price of the green candlestick.
-
The bearish engulfing pattern indicates that sellers have taken control of the market and are pushing the price lower.
-
The pattern can be a strong signal of a potential trend reversal, but it's important to confirm the pattern with other technical indicators and market analysis.
-
Some traders use the bearish engulfing pattern as a sell signal, placing a short position with a stop loss above the high of the green candlestick and a profit target based on the potential length of the downtrend.
-
Traders should also consider the overall market context and fundamental factors that may be influencing the price action, as well as any potential risks or uncertainties that could impact the trade.
Overall, the bearish engulfing pattern is a popular candlestick pattern among traders, as it can provide valuable insights into potential trend reversals and opportunities for profitable trades. However, it's important to use the pattern in conjunction with other technical indicators and market analysis, and to always consider the potential risks and uncertainties of the trade.
Inverted Hammer Pattern

-
The inverted hammer pattern is a single candlestick pattern that can occur in both uptrends and downtrends, but is most commonly seen in downtrends.
-
The pattern consists of a candlestick with a small body and a long upper shadow, and little to no lower shadow.
-
The opening price of the candlestick is typically similar to the closing price, with most of the trading activity occurring near the high of the candlestick.
-
The inverted hammer pattern suggests that buyers have attempted to push the price higher, but were ultimately unsuccessful in sustaining the upward momentum.
-
The pattern can be a signal of a potential trend reversal, particularly if it occurs after a prolonged downtrend or in conjunction with other technical indicators and market analysis.
-
Some traders may use the inverted hammer pattern as a buy signal, placing a long position with a stop loss below the low of the candlestick and a profit target based on the potential length of the uptrend.
-
Traders should also consider the overall market context and fundamental factors that may be influencing the price action, as well as any potential risks or uncertainties that could impact the trade.
Overall, the inverted hammer pattern is a candlestick pattern that can provide valuable insights into potential trend reversals and opportunities for profitable trades. However, like any technical analysis tool, it should be used in conjunction with other indicators and market analysis to make informed trading decisions.
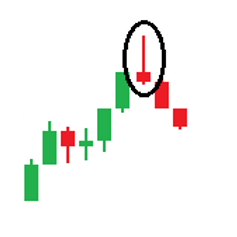
Shooting Star Pattern
-
The shooting star pattern is a single candlestick pattern that can occur in both uptrends and downtrends, but is most commonly seen in uptrends.
-
The pattern consists of a candlestick with a small body and a long upper shadow, and little to no lower shadow.
-
The opening price of the candlestick is typically similar to the closing price, with most of the trading activity occurring near the high of the candlestick.
-
The shooting star pattern suggests that sellers have attempted to push the price lower, but were ultimately unsuccessful in sustaining the downward momentum.
-
The pattern can be a signal of a potential trend reversal, particularly if it occurs after a prolonged uptrend or in conjunction with other technical indicators and market analysis.
-
Some traders may use the shooting star pattern as a sell signal, placing a short position with a stop loss above the high of the candlestick and a profit target based on the potential length of the downtrend.
-
Traders should also consider the overall market context and fundamental factors that may be influencing the price action, as well as any potential risks or uncertainties that could impact the trade.
Overall, the shooting star pattern is a candlestick pattern that can provide valuable insights into potential trend reversals and opportunities for profitable trades. However, like any technical analysis tool, it should be used in conjunction with other indicators and market analysis to make informed trading decisions.
Hammer Pattern

-
The hammer pattern is a single candlestick pattern that can occur in both uptrends and downtrends, but is most commonly seen in downtrends.
-
The pattern consists of a candlestick with a small body and a long lower shadow, and little to no upper shadow.
-
The opening price of the candlestick is typically similar to the closing price, with most of the trading activity occurring near the low of the candlestick.
-
The hammer pattern suggests that buyers have attempted to push the price higher, and were successful in reversing the downward momentum.
-
The pattern can be a signal of a potential trend reversal, particularly if it occurs after a prolonged downtrend or in conjunction with other technical indicators and market analysis.
-
Some traders may use the hammer pattern as a buy signal, placing a long position with a stop loss below the low of the candlestick and a profit target based on the potential length of the uptrend.
-
Traders should also consider the overall market context and fundamental factors that may be influencing the price action, as well as any potential risks or uncertainties that could impact the trade.
Overall, the hammer pattern is a candlestick pattern that can provide valuable insights into potential trend reversals and opportunities for profitable trades. However, like any technical analysis tool, it should be used in conjunction with other indicators and market analysis to make informed trading decisions.
Hanging Man Pattern

-
The hanging man pattern is a single candlestick pattern that can occur in both uptrends and downtrends, but is most commonly seen in uptrends.
-
The pattern consists of a candlestick with a small body and a long lower shadow, and little to no upper shadow.
-
The opening price of the candlestick is typically similar to the closing price, with most of the trading activity occurring near the low of the candlestick.
-
The hanging man pattern suggests that sellers have attempted to push the price lower, and were successful in reversing the upward momentum.
-
The pattern can be a signal of a potential trend reversal, particularly if it occurs after a prolonged uptrend or in conjunction with other technical indicators and market analysis.
-
Some traders may use the hanging man pattern as a sell signal, placing a short position with a stop loss above the high of the candlestick and a profit target based on the potential length of the downtrend.
-
Traders should also consider the overall market context and fundamental factors that may be influencing the price action, as well as any potential risks or uncertainties that could impact the trade.
Overall, the hanging man pattern is a candlestick pattern that can provide valuable insights into potential trend reversals and opportunities for profitable trades. However, like any technical analysis tool, it should be used in conjunction with other indicators and market analysis to make informed trading decisions.
Morning Star Pattern

-
The morning star pattern is a three-candlestick pattern that occurs in downtrends.
-
The pattern consists of a long bearish candlestick, followed by a short bearish or bullish candlestick with a gap down in between, and finally a long bullish candlestick that closes above the midpoint of the first candlestick.
-
The morning star pattern suggests that sellers have lost control of the market, and buyers are beginning to take over.
-
The pattern can be a signal of a potential trend reversal, particularly if it occurs after a prolonged downtrend or in conjunction with other technical indicators and market analysis.
-
Some traders may use the morning star pattern as a buy signal, placing a long position with a stop loss below the low of the first candlestick and a profit target based on the potential length of the uptrend.
-
Traders should also consider the overall market context and fundamental factors that may be influencing the price action, as well as any potential risks or uncertainties that could impact the trade.
Overall, the morning star pattern is a candlestick pattern that can provide valuable insights into potential trend reversals and opportunities for profitable trades. However, like any technical analysis tool, it should be used in conjunction with other indicators and market analysis to make informed trading decisions.
Evening Star Pattern

-
The evening star pattern is a three-candlestick pattern that occurs in uptrends.
-
The pattern consists of a long bullish candlestick, followed by a short bearish or bullish candlestick with a gap up in between, and finally a long bearish candlestick that closes below the midpoint of the first candlestick.
-
The evening star pattern suggests that buyers have lost control of the market, and sellers are beginning to take over.
-
The pattern can be a signal of a potential trend reversal, particularly if it occurs after a prolonged uptrend or in conjunction with other technical indicators and market analysis.
-
Some traders may use the evening star pattern as a sell signal, placing a short position with a stop loss above the high of the first candlestick and a profit target based on the potential length of the downtrend.
-
Traders should also consider the overall market context and fundamental factors that may be influencing the price action, as well as any potential risks or uncertainties that could impact the trade.
Overall, the evening star pattern is a candlestick pattern that can provide valuable insights into potential trend reversals and opportunities for profitable trades. However, like any technical analysis tool, it should be used in conjunction with other indicators and market analysis to make informed trading decisions.
Tweezer Bottom Pattern

-
The tweezer bottom pattern is a two-candlestick pattern that occurs in downtrends.
-
The pattern consists of two candlesticks with long lower shadows and small bodies, that form a bottom at the same price level, suggesting a support level has been reached.
-
The tweezer bottom pattern can be a signal of a potential trend reversal, particularly if it occurs after a prolonged downtrend or in conjunction with other technical indicators and market analysis.
-
Some traders may use the tweezer bottom pattern as a buy signal, placing a long position with a stop loss below the low of the second candlestick and a profit target based on the potential length of the uptrend.
-
Traders should also consider the overall market context and fundamental factors that may be influencing the price action, as well as any potential risks or uncertainties that could impact the trade.
Overall, the tweezer bottom pattern is a candlestick pattern that can provide valuable insights into potential trend reversals and opportunities for profitable trades. However, like any technical analysis tool, it should be used in conjunction with other indicators and market analysis to make informed trading decisions.
Tweezer Top Pattern

-
The tweezer top pattern is a two-candlestick pattern that occurs in uptrends.
-
The pattern consists of two candlesticks with long upper shadows and small bodies, that form a top at the same price level, suggesting a resistance level has been reached.
-
The tweezer top pattern can be a signal of a potential trend reversal, particularly if it occurs after a prolonged uptrend or in conjunction with other technical indicators and market analysis.
-
Some traders may use the tweezer top pattern as a sell signal, placing a short position with a stop loss above the high of the second candlestick and a profit target based on the potential length of the downtrend.
-
Traders should also consider the overall market context and fundamental factors that may be influencing the price action, as well as any potential risks or uncertainties that could impact the trade.
Overall, the tweezer top pattern is a candlestick pattern that can provide valuable insights into potential trend reversals and opportunities for profitable trades. However, like any technical analysis tool, it should be used in conjunction with other indicators and market analysis to make informed trading decisions.
Three White Soldiers Pattern

-
The three white soldiers pattern is a three-candlestick pattern that occurs in downtrends.
-
The pattern consists of three long bullish candlesticks that close near their highs, with each subsequent candlestick opening higher than the previous one.
-
The three white soldiers pattern suggests a strong bullish sentiment has taken hold of the market and buyers have taken control of the price action.
-
The pattern can be a signal of a potential trend reversal, particularly if it occurs after a prolonged downtrend or in conjunction with other technical indicators and market analysis.
-
Some traders may use the three white soldiers pattern as a buy signal, placing a long position with a stop loss below the low of the third candlestick and a profit target based on the potential length of the uptrend.
-
Traders should also consider the overall market context and fundamental factors that may be influencing the price action, as well as any potential risks or uncertainties that could impact the trade.
Overall, the three white soldiers pattern is a candlestick pattern that can provide valuable insights into potential trend reversals and opportunities for profitable trades. However, like any technical analysis tool, it should be used in conjunction with other indicators and market analysis to make informed trading decisions.
Three Black Crows Pattern

-
The three black crows pattern is a three-candlestick pattern that occurs in uptrends.
-
The pattern consists of three long bearish candlesticks that close near their lows, with each subsequent candlestick opening lower than the previous one.
-
The three black crows pattern suggests a strong bearish sentiment has taken hold of the market and sellers have taken control of the price action.
-
The pattern can be a signal of a potential trend reversal, particularly if it occurs after a prolonged uptrend or in conjunction with other technical indicators and market analysis.
-
Some traders may use the three black crows pattern as a sell signal, placing a short position with a stop loss above the high of the third candlestick and a profit target based on the potential length of the downtrend.
-
Traders should also consider the overall market context and fundamental factors that may be influencing the price action, as well as any potential risks or uncertainties that could impact the trade.
Overall, the three black crows pattern is a candlestick pattern that can provide valuable insights into potential trend reversals and opportunities for profitable trades. However, like any technical analysis tool, it should be used in conjunction with other indicators and market analysis to make informed trading decisions.
Three Inside Up Pattern

-
The three inside up pattern is a three-candlestick pattern that occurs in downtrends.
-
The pattern consists of a long bearish candlestick, followed by a smaller bullish candlestick that is completely engulfed by the first one, and a third bullish candlestick that closes above the high of the second one.
-
The three inside up pattern suggests a potential reversal of the downtrend, as the bulls have taken control of the price action after a period of bearish sentiment.
-
The pattern can be a signal of a potential trend reversal, particularly if it occurs after a prolonged downtrend or in conjunction with other technical indicators and market analysis.
-
Some traders may use the three inside up pattern as a buy signal, placing a long position with a stop loss below the low of the first candlestick and a profit target based on the potential length of the uptrend.
-
Traders should also consider the overall market context and fundamental factors that may be influencing the price action, as well as any potential risks or uncertainties that could impact the trade.
Overall, the three inside up pattern is a candlestick pattern that can provide valuable insights into potential trend reversals and opportunities for profitable trades. However, like any technical analysis tool, it should be used in conjunction with other indicators and market analysis to make informed trading decisions.
Three Inside Down Pattern

-
The three inside down pattern is a three-candlestick pattern that occurs in uptrends.
-
The pattern consists of a long bullish candlestick, followed by a smaller bearish candlestick that is completely engulfed by the first one, and a third bearish candlestick that closes below the low of the second one.
-
The three inside down pattern suggests a potential reversal of the uptrend, as the bears have taken control of the price action after a period of bullish sentiment.
-
The pattern can be a signal of a potential trend reversal, particularly if it occurs after a prolonged uptrend or in conjunction with other technical indicators and market analysis.
-
Some traders may use the three inside down pattern as a sell signal, placing a short position with a stop loss above the high of the first candlestick and a profit target based on the potential length of the downtrend.
-
Traders should also consider the overall market context and fundamental factors that may be influencing the price action, as well as any potential risks or uncertainties that could impact the trade.
Overall, the three inside down pattern is a candlestick pattern that can provide valuable insights into potential trend reversals and opportunities for profitable trades. However, like any technical analysis tool, it should be used in conjunction with other indicators and market analysis to make informed trading decisions.
Doji's Pattern

-
A doji is a single candlestick pattern that occurs when the opening and closing price of an asset are very close or equal, resulting in a small or nonexistent real body.
-
Doji candlesticks indicate indecision in the market, as buyers and sellers are evenly matched and unable to push the price in a clear direction.
-
There are different types of doji candles, including the long-legged doji, dragonfly doji, gravestone doji and four price doji each with their own unique characteristics and potential implications.
-
Doji candles are often seen as potential reversal signals, particularly if they occur after a prolonged trend or in conjunction with other technical indicators and market analysis.
-
Traders may use doji candles as a signal to take a wait-and-see approach, as they suggest that the market is currently in a state of equilibrium and that a clearer trend may emerge in the near future.
-
It is important to consider the context in which the doji appears, as well as any potential support or resistance levels that may impact the price action.
Overall, doji candlesticks can be a useful tool for technical analysis and can provide valuable insights into potential trend reversals and opportunities for profitable trades. However, like any technical analysis tool, they should be used in conjunction with other indicators and market analysis to make informed trading decisions.
Long-Legged Doji Pattern

-
The long-legged doji is a single candlestick pattern that occurs when the opening and closing price of an asset are very close or equal, resulting in a small or nonexistent real body, and with long upper and lower wicks.
-
The long-legged doji indicates a state of equilibrium between buyers and sellers, with both sides unable to push the price in a clear direction.
-
The long upper and lower wicks of the long-legged doji suggest that there was significant price volatility during the trading session, with the price fluctuating between the high and low before ultimately settling near the opening price.
-
The long-legged doji is often seen as a potential reversal signal, particularly if it occurs after a prolonged trend or in conjunction with other technical indicators and market analysis.
-
Traders may use the long-legged doji as a signal to take a wait-and-see approach, as it suggests that the market is currently in a state of uncertainty and that a clearer trend may emerge in the near future.
-
It is important to consider the context in which the long-legged doji appears, as well as any potential support or resistance levels that may impact the price action.
Overall, the long-legged doji can be a useful tool for technical analysis and can provide valuable insights into potential trend reversals and opportunities for profitable trades. However, like any technical analysis tool, it should be used in conjunction with other indicators and market analysis to make informed trading decisions.
Dragonfly Doji Pattern

-
The Dragonfly doji is a single candlestick pattern that occurs when the opening and closing price of an asset are at or near the high of the trading session, with a long lower wick and no or a very small upper wick.
-
The Dragonfly doji indicates that buyers have taken control of the market, pushing the price up from the low of the session to the high before ultimately settling near the opening price.
-
The long lower wick of the Dragonfly doji suggests that there was significant buying pressure during the trading session, with buyers stepping in to support the price and prevent it from falling further.
-
The Dragonfly doji is often seen as a potential reversal signal, particularly if it occurs after a prolonged downtrend or in conjunction with other technical indicators and market analysis.
-
Traders may use the Dragonfly doji as a signal to take a bullish stance, as it suggests that buyers are in control and that a potential trend reversal may be imminent.
-
It is important to consider the context in which the Dragonfly doji appears, as well as any potential support or resistance levels that may impact the price action.
Overall, the Dragonfly doji can be a useful tool for technical analysis and can provide valuable insights into potential trend reversals and opportunities for profitable trades. However, like any technical analysis tool, it should be used in conjunction with other indicators and market analysis to make informed trading decisions.
Gravestone Doji Pattern

-
The Gravestone doji is a single candlestick pattern that occurs when the opening and closing price of an asset are at or near the low of the trading session, with a long upper wick and no or a very small lower wick.
-
The Gravestone doji indicates that sellers have taken control of the market, pushing the price down from the high of the session to the low before ultimately settling near the opening price.
-
The long upper wick of the Gravestone doji suggests that there was significant selling pressure during the trading session, with sellers stepping in to push the price down and prevent it from rising further.
-
The Gravestone doji is often seen as a potential reversal signal, particularly if it occurs after a prolonged uptrend or in conjunction with other technical indicators and market analysis.
-
Traders may use the Gravestone doji as a signal to take a bearish stance, as it suggests that sellers are in control and that a potential trend reversal may be imminent.
-
It is important to consider the context in which the Gravestone doji appears, as well as any potential support or resistance levels that may impact the price action.
Overall, the Gravestone doji can be a useful tool for technical analysis and can provide valuable insights into potential trend reversals and opportunities for profitable trades. However, like any technical analysis tool, it should be used in conjunction with other indicators and market analysis to make informed trading decisions.
Four Price Doji Pattern

-
The Four Price Doji is a candlestick pattern that occurs when the opening, closing, high, and low prices are all the same or very close to each other. This creates a square shape, indicating indecision in the market.
-
This pattern is rare, as all four prices being the same or nearly the same is not a common occurrence in the market.
-
The Four Price Doji is usually seen as a sign of consolidation or a pause in the trend, indicating that buyers and sellers are in equilibrium.
-
If the Four Price Doji appears after a prolonged trend, it can suggest that the market may be reaching a top or bottom and may experience a trend reversal.
-
The pattern can be interpreted in different ways depending on the context of the market and other technical indicators, and traders should always perform additional analysis before making trading decisions based solely on the Four Price Doji pattern.
Overall, the Four Price Doji pattern can be a useful tool for technical analysis, particularly when it appears after a prolonged trend or during a period of consolidation. However, as with any technical analysis tool, it should be used in conjunction with other indicators and market analysis to make informed trading decisions.
What are Support and resistance levels ?
Support and resistance levels are a key tool for Forex traders to analyze market trends and make informed trading decisions. These levels represent areas where the price of an asset has historically shown a tendency to either reverse or stall. In this article, we will explain the basics of support and resistance levels and how to use them to your advantage in Forex trading.
What are Support and Resistance Levels / Supply and Demand zones ?
Support and resistance levels are areas on a price chart where the price of an asset has historically shown a tendency to either reverse or stall. Support levels represent areas where buying pressure is strong enough to prevent the price from falling further, while resistance levels represent areas where selling pressure is strong enough to prevent the price from rising further.
Support levels are often identified by looking for areas where the price has bounced off a certain level multiple times in the past. Resistance levels can be identified by looking for areas where the price has been unable to break through a certain level multiple times in the past.
Using Support and Resistance Levels in Forex Trading
Support and resistance levels can be used to identify potential buying and selling opportunities in the Forex market. Here are a few ways that you can use support and resistance levels to your advantage in Forex trading:
-
Identifying Trends: Support and resistance levels can be used to identify trends in the market, which can be helpful in determining whether to buy or sell a currency pair. An uptrend is identified by a series of higher highs and higher lows, while a downtrend is identified by a series of lower highs and lower lows. Support levels can be used as potential entry points for long positions during uptrends, while resistance levels can be used as potential entry points for short positions during downtrends.
-
Recognizing Breakouts: Support and resistance levels can also be used to recognize potential breakouts in the market. A breakout occurs when the price of an asset breaks through a significant support or resistance level. This can be used as a signal to enter a long or short position, depending on the direction of the breakout.
-
Using Indicators: Support and resistance levels can be used in conjunction with technical indicators, such as moving averages and RSI, to confirm potential trading signals. For example, if a support level is identified, a trader may use a moving average crossover as a confirmation signal to enter a long position.
-
Managing Risk: Support and resistance levels can also be used to manage risk in Forex trading. Traders can set stop-loss orders based on key support and resistance levels identified on the chart, which can limit their losses if the market moves against them.
In conclusion support and resistance levels are a valuable tool for Forex traders, providing a way to identify potential buying and selling opportunities in the market. By using support and resistance levels in conjunction with technical indicators and risk management strategies, traders can make informed trading decisions and improve their chances of success in Forex trading. It is important to keep in mind that support and resistance levels are just one tool among many that traders can use to analyze the market, and should not be relied on exclusively.


What are Trendlines and channels ?
Trendlines and channels are important tools for forex traders to analyze market trends and identify potential trading opportunities. These tools are used to identify the direction of the trend and to help traders determine when to enter or exit a position. In this article, we will explain the basics of trendlines and channels and how to use them to your advantage in forex trading.
What are Trendlines and Channels ?
Trendlines are lines drawn on a chart to connect two or more price points, creating a trend. A rising trendline connects two or more ascending lows, while a falling trendline connects two or more descending highs. Trendlines are used to identify the direction of the trend and to help traders determine when to enter or exit a position.
Channels are created by drawing two parallel trendlines, one connecting the highs and the other connecting the lows. A rising channel is created by drawing a rising trendline and a parallel horizontal trendline connecting the highs, while a falling channel is created by drawing a falling trendline and a parallel horizontal trendline connecting the lows. Channels are used to identify potential areas of support and resistance within the trend.
Using Trendlines and Channels in Forex Trading
Trendlines and channels can be used to identify potential trading opportunities in the forex market. Here are a few ways that you can use trendlines and channels to your advantage in forex trading:
-
Identifying Trends: Trendlines and channels can be used to identify the direction of the trend in the market. An uptrend is identified by a series of higher highs and higher lows, while a downtrend is identified by a series of lower highs and lower lows. Trendlines can be used to identify potential entry points for long positions during uptrends, while channels can be used to identify potential entry points for short positions during downtrends.
-
Recognizing Breakouts: Trendlines and channels can also be used to recognize potential breakouts in the market. A breakout occurs when the price of an asset breaks through a significant trendline or channel. This can be used as a signal to enter a long or short position, depending on the direction of the breakout.
-
Using Indicators: Trendlines and channels can be used in conjunction with technical indicators, such as moving averages and RSI, to confirm potential trading signals. For example, if a rising trendline is identified, a trader may use a moving average crossover as a confirmation signal to enter a long position.
-
Managing Risk: Trendlines and channels can also be used to manage risk in forex trading. Traders can set stop-loss orders based on key trendlines and channels identified on the chart, which can limit their losses if the market moves against them.
In conclusion trendlines and channels are important tools for forex traders, providing a way to identify potential trading opportunities in the market. By using trendlines and channels in conjunction with technical indicators and risk management strategies, traders can make informed trading decisions and improve their chances of success in forex trading. It is important to keep in mind that trendlines and channels are just one tool among many that traders can use to analyze the market, and should not be relied on exclusively.
What are Moving averages ?
Moving averages are an important technical analysis tool that forex traders use to identify trends and potential trading opportunities. By smoothing out price fluctuations, moving averages help traders determine the overall direction of the market and identify potential entry and exit points. In this article, we will explain the basics of moving averages and how to use them to your advantage in forex trading.
What are Moving Averages ?
Moving averages are calculated by averaging the prices of an asset over a specific period of time, such as 10, 50, or 200 days. The resulting line, which represents the average price over that time period, is then plotted on the chart. By smoothing out the price fluctuations, moving averages provide a clearer picture of the market trend.
There are two main types of moving averages: simple moving averages (SMA) and exponential moving averages (EMA). Simple moving averages give equal weight to all data points in the time period, while exponential moving averages give more weight to recent data points, making them more responsive to changes in the market.
Using Moving Averages in Forex Trading
Moving averages are used by forex traders in several ways. Here are a few ways that you can use moving averages to your advantage in forex trading:
-
Identifying Trends: Moving averages can be used to identify the direction of the trend in the market. During an uptrend, the price of the asset will generally be above the moving average, while during a downtrend, the price will generally be below the moving average. Traders can use this information to identify potential entry points for long or short positions.
-
Identifying Support and Resistance Levels: Moving averages can also be used to identify potential areas of support and resistance. During an uptrend, the moving average can act as a level of support, while during a downtrend, it can act as a level of resistance. Traders can use this information to set stop-loss orders or take-profit orders.
-
Identifying Crossovers: Moving averages can also be used to identify potential trading signals. When a shorter-term moving average crosses above a longer-term moving average, it is considered a bullish signal, indicating that the price is likely to continue rising. Conversely, when a shorter-term moving average crosses below a longer-term moving average, it is considered a bearish signal, indicating that the price is likely to continue falling.
-
Using Multiple Moving Averages: Traders can also use multiple moving averages to identify potential trading opportunities. By using a combination of shorter-term and longer-term moving averages, traders can get a more complete picture of the market trend and identify potential entry and exit points.
In conclusion moving averages are an important tool for forex traders, providing a way to identify potential trading opportunities in the market. By using moving averages in conjunction with other technical indicators and risk management strategies, traders can make informed trading decisions and improve their chances of success in forex trading. It is important to keep in mind that moving averages are just one tool among many that traders can use to analyze the market, and should not be relied on exclusively.
What are Indicators (RSI, MACD, etc.) ?
When it comes to forex trading, there are a variety of technical indicators that traders can use to help identify potential trading opportunities. Indicators are mathematical calculations based on the price and/or volume of a currency pair, and they are used to provide insight into the strength and direction of the trend. In this article, we will explore some of the most commonly used indicators in forex trading and how they can be used to your advantage.
Relative Strength Index (RSI)
The Relative Strength Index (RSI) is a popular momentum indicator that measures the strength of a currency pair's price action over a certain period of time. It ranges from 0 to 100, with readings above 70 indicating overbought conditions and readings below 30 indicating oversold conditions. Traders can use the RSI to identify potential reversal points or to confirm the strength of a trend.
Moving Average Convergence Divergence (MACD)
The Moving Average Convergence Divergence (MACD) is a trend-following momentum indicator that consists of two lines - the MACD line and the signal line. The MACD line is calculated by subtracting the 26-period Exponential Moving Average (EMA) from the 12-period EMA, while the signal line is a 9-period EMA of the MACD line. Traders can use the MACD to identify potential trend reversals or to confirm the strength of a trend.
Bollinger Bands
Bollinger Bands are a volatility indicator that consists of three lines - a simple moving average (usually 20 periods) in the middle, and an upper and lower band that are two standard deviations away from the moving average. Traders can use Bollinger Bands to identify potential overbought or oversold conditions, as well as to determine the strength and direction of the trend.
Moving Averages
Moving Averages are a popular indicator used to identify trends and potential trading opportunities. They are calculated by averaging the prices of a currency pair over a specific period of time, such as 10, 50, or 200 days. Traders can use moving averages to identify potential entry and exit points, as well as to determine the strength and direction of the trend.
Stochastic Oscillator
The Stochastic Oscillator is a momentum indicator that compares a currency pair's closing price to its price range over a certain period of time. It ranges from 0 to 100, with readings above 80 indicating overbought conditions and readings below 20 indicating oversold conditions. Traders can use the Stochastic Oscillator to identify potential reversal points or to confirm the strength of a trend.
In conclusion there are many different technical indicators that traders can use in forex trading, and the ones mentioned above are just a few examples. It is important to note that no single indicator can guarantee profits, and traders should use a combination of indicators and other tools, such as price action analysis and risk management strategies, to make informed trading decisions. By understanding the strengths and limitations of each indicator, traders can use them to their advantage and improve their chances of success in forex trading.